Engineers are available to assist.

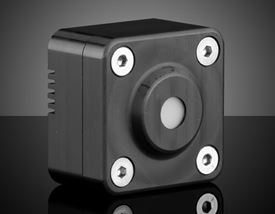
Compact Irradiance Calibrated Spectrometers are designed with a compact, lightweight 32 x 32 x 21.3mm Form Factor for easy system integration or standalone benchtop use via an M4 thread for post mounting. Unlike conventional spectrometers, these devices utilize a novel Mach-Zehnder equivalent crystal array with no gratings, prisms, or moving parts to create an interferogram which, through Fourier Transformation, produces a low-noise spectrum. This spectrometer is calibrated to Helium-Neon (HeNe) laser sources at 543.4 and 632.8nm and a QTH lamp to provide an absolute spectral irradiance measurement in units of W/m2/nm. Compact Irradiance Calibrated Spectrometers feature a spectral range of 450 – 850nm and are ideal for use in spectroscopy applications in the visible to near-infrared (NIR) wavelength range, such as chemical analysis and colorimetry applications. These devices are USB powered via a USB 3.0 locking cable for secure connection and are controlled via an easy-to-use GUI.
This Compact Irradiance Calibrated Spectrometer comes with a USB thumb drive containing the frinGOe software, spectrometer drivers, API reference, and Python example code. The frinGOe software provides a spectrum plot that displays the spectrum of the source as a function of spectral irradiance vs wavelength. This data can be exported either as an individual frame or as a continuous measurement. The Exposure Time can be adjusted manually between 1 and 100ms, with a saturation bar indicating the pixel saturation level. For accurate results and to prevent damage, ensure that the saturation is not at 100%. An Auto Exposure feature can be used to automatically adjust the exposure time such that the maximum sensor saturation is approximately 90%. Additionally, the Number of Averages can be set between 1 and 512 to increase the signal-to-noise ratio (SNR) at the cost of longer measurement time. A Colorimetry frame displays the chromaticity coordinates of the current measurement on a CIE 1976 UCS (uniform chromaticity scale) diagram. This spectrometer can be integrated into existing systems and controlled via Python. Please refer to the API for a list of commands and the included Python code for implementation examples.


or view regional numbers
QUOTE TOOL
enter stock numbers to begin
Copyright 2023 | Edmund Optics, Ltd Unit 1, Opus Avenue, Nether Poppleton, York, YO26 6BL, UK
California Consumer Privacy Acts (CCPA): Do Not Sell or Share My Personal Information
California Transparency in Supply Chains Act
This content may include material that has been generated or modified using artificial intelligence (AI).
The FUTURE Depends On Optics®