Depth of Field and Depth of Focus
Authors: Gregory Hollows, Nicholas James
This is Section 3.4 of the Imaging Resource Guide.
Due to similarity in name and nature, depth of field (DOF) and depth of focus are commonly confused concepts. To simplify the definitions, DOF concerns the image quality of a stationary lens as an object is repositioned, whereas depth of focus concerns a stationary object and a sensor’s ability to maintain focus for different sensor positions, including tilt.
Depth of Field
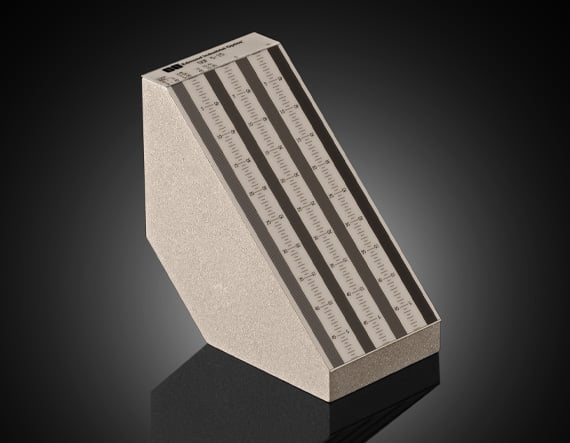
The DOF of a lens is its ability to maintain a desired amount of image quality (spatial frequency at a specified contrast), without refocusing, if the object position is moved closer and farther from the plane of best focus. DOF also applies to objects with complex geometries or features of different height. As an object is placed closer to or farther than the set focus distance of a lens, the object blurs and both resolution and contrast suffer. As such, DOF only makes sense if it is defined with an associated resolution and contrast. Several targets can be used to directly measure and benchmark an imaging system’s DOF; these targets are detailed in Test Target Overview.
Resolution and DOF
“Does this lens have good DOF?” It is difficult to quantify without specifying an object detail size or image space frequency. The smaller the detail, the higher the spatial frequency needed, and the smaller the DOF the lens can produce. A DOF curve can be used to see how a lens performs over a given depth at a specific detail’s size (Lens Performance Curves). These graphs not only consider theoretical limitations associated with the f/# setting, but also the aberrational effects of the lens design.
In Figure 1, contrast values (y-axis) are seen over a WD range (x-axis) at a fixed frequency of 20$ \small{\tfrac{\text{lp}}{\text{mm}}} $ (image detail). Note the difference in DOF between Figure 1a, which is set at f/2.8, and Figure 1b, which is set at f/4. Also note that there is more usable DOF beyond the best focus than between the best focus and the lens, due to magnification decreasing. The graphs themselves contain different colored lines denoting different sensor positions. These types of asymmetric DOF curves are common in fixed focal length lenses.

Figure 1: DOF curves for a lens at f/2.8 (a) and f/4 (b).
Figure 2 features the same lens as Figure 1a but at a different WD. Note an increase in DOF occurs at longer WDs. Eventually, as the lens focuses on objects infinitely far away, the hyperfocal condition occurs. This condition is reached at the distance in which everything appears in equal focus.

Figure 2: DOF curves for a lens at f/2.8 at 200mm WD (a) and at 500nm WD (b). Note (a) has a much larger scale.
How f/# Affects DOF
Changing the f/# of a lens changes DOF, shown in Figure 3. For each configuration shown in Figure 3 there are two bundles of rays. The bundle represented by dotted black lines shows how well the lens is focused. As an object moves away from the best focus position (where the dotted lines cross), object details move into a wider area of the cone. The wider the spread of the cone, the more the image blurs into the surroundings. The f/# of the lens controls how quickly the cone expands and how much information or detail is blurred together at a given distance. Figure 3a shows a lens with a shallow DOF, where Figure 3b shows a lens with a large DOF.

Figure 3: Geometric representation of DOF for high and low f/# lenses.
The red cone in Figure 3 is an angular representation of the system resolution. Where the lines of the red cone and dotted black cone intersect defines the total range of the DOF. The lower the f/#, the faster the black dotted lines expand, and the lower the DOF.
As details get smaller (represented by a smaller red cone), the bundles in Figure 3a and 3b move closer together. Eventually, increasing the f/# too much causes smaller details to blur due to reaching the lens diffraction limit, since the limiting resolution of the lens is inversely proportional to f/#. This limitation means that while increasing the f/# will always increase the DOF, the minimum resolvable feature size (even at best focus) increases. For more information on the diffraction limit and its relationship to f/#, see The Airy Disk and Diffraction Limit. Using short wavelengths helps to salvage some of this resolution. Learn more about how wavelength affects system performance in MTF Curves and Lens Performance. Note that this diffraction effect is not viewable in Figure 3, but that it is mentioned here as something to mind.
In general, when lenses are focused at short WDs, the large cone angles cause the cones to diverge very quickly on either side of best focus, leading to limited DOF. For objects in focus at longer WDs, the transition rate of the bundles decreases and DOF will increase.
Ex: f/# Effects Close Up at the Object Level
Figure 4a illustrates the ray bundle at the center of an object under inspection at f/2.8 (a) and f/8 (b). The vertical lines represent 2mm increments away from best focus. On each vertical line, a square represents the discrete feature size of single pixel of detail. Figure 4a shows that as the width of the ray bundle spreads out, more rays miss the detail. In Figure 4b, the bundle expands more slowly and the rays all strike the detail which is larger than the bundle diameter for all depths shown.

Figure 4: An illustration of the ray bundle at the center of an object under inspection at f/2.8 (a) and f/8 (b).
Figure 5 shows the same concept as Figure 4, but the cones represent multiple points in the FOV. Each detail and subsequent space represent one line pair. The overlap in the bundles in Figure 5a shows how the information blends together faster than that of Figure 4b and shows how two different object details can blur together due to a lower f/#. In Figure 5b, this does not occur due to the higher f/# of the lens.

Figure 5: An illustration of the ray bundles across a portion of the center of the FOV at f/2.8 (a) and f/8 (b).
Depth of Focus - ADVANCED
Depth of focus is the image-space complement of DOF and is related to how the quality of focus changes on the sensor side of the lens as the sensor is moved, while the object remains in the same position. Depth of focus characterizes how much tip and tilt is tolerated between the lens image plane and the sensor plane itself. As f/# decreases, the depth of focus does as well, which increases the impact that tilt has on achieving best focus across the sensor. Without active alignment, there will always be some degree of variation in the orthogonality between the sensor and the lens that is used; Figure 6 shows how this issue arises. It is generally assumed that problems involving depth of focus only occur with large sensors.
However, this issue is independent of sensor size. As the derivation in Equation 3 shows, depth of focus, $\delta $, is heavily dependent on the number of pixels or pixel count, $ p $, and has little to do with array or pixel size, $ s $. As sensors increase in pixel count, this issue is more evident. Particularly in many line scan applications, the large arrays and low f/#s emphasize the need for careful alignment between the object, lens, and sensor.
\frac{\delta}{2} & > z \\
\left( f / \# \right)_w & > \frac{1}{2} \left( p \times \tan{\alpha} \right)
\end{align}
\frac{\delta}{2} & > z \\
\left( f / \# \right)_w & > \frac{1}{2} \left( p \times \tan{\alpha} \right)
\end{align}

Figure 6: How sensor tilt, with respect to the optical axis, affects depth of focus, at the pixel level (a) and the sensor level (b).
Effects of Sensor Tilt
Figure 7 shows a 35mm lens using 470nm illumination. Figure 7a is set to f/2.8 and Figure 7b is set to f/5.6. Both graphs go out to 150$ \small{\tfrac{\text{lp}}{\text{mm}}} $—the Nyquist limit of a sensor with 3.45µm pixels. It is easy to see that the performance of Figure 7a is far better than Figure 7b, using this lens at a setting of f/2.8 provides the highest level of imaging quality in a given object plane. However, as discussed in the previous section, sensor tilt will negatively impact the image quality produced, and the higher the number of pixels, the more pronounced the effect.

Figure 7: MTF performance for a 35mm lens at f/2.8 (a) and f/5.6 (b). Note, both designs perform nearly at the diffraction limit.
Figure 8 analyzes the depth of focus for the two cases in Figure 7. In both cases, the far right vertical line is at the best focus for the full image. Each semi-vertical line to the left of best focus represents a position 12.5µm closer to the back of the lens. These simulate the positions of the pixels, assuming a tip/tilt of 12.5µm and 25µm respectively from the center to the corner of the sensor. The blue ray bundle shows the image center and the yellow and red ray bundles show the corners of the image. The yellow and red bundles represent one line pair cycle on the sensor assuming 3.45µm pixels. Notice in Figure 8a, that for f/2.8 there is already bleed-over between the yellow and red ray bundles at the shift to the 12.5µm tilt position. Moving out to 25µm, the red bundle now covers two full pixels and about half the yellow bundle as well. This causes significant blurring. In Figure 8b, for f/5.6, the yellow and red ray bundles stay within one pixel over the full 25µm tilt range. Note that the blue pixel’s position does not change, as the tip/ tilt is centered on this pixel.

Figure 8: Ray bundles of the same 35mm focal length lens at f/2.8 (a) and f/5.6 (b) in image space. The blue ray bundle is in the center of the image; the red and yellow bundles are at the corner of the image.
Figure 9 shows the change in MTF performance at the corner of the image for this 35mm lens assuming 25µm of tilt, seen in Figure 8. Figure 9a shows the new performance of the lens at f/2.8; note the decrease in performance from Figure 9a. Figure 9b shows the performance shift at f/5.6, which is minor compared to 9a. Most importantly, the lens at f/5.6 will now outperform the one at f/2.8. The drawback to running systems at f/5.6 is three times less light relative to f/2.8 and this can be problematic in high speed or line scan applications. Finally, if the sensor is tilted about the its center, performance decrease occurs at both the top and bottom of the sensor (and the corresponding points in the FOV), since the ray bundles expand after the best focus. No two camera and lens combinations are identical. When building multiple systems, this fact can manifest at different degrees of magnitude.

Figure 9: MTF performance of a 35mm lens at f/2.8 (a) and f/5.6 (b), and with 25μm of z-axis shift caused by image plane tilt.
To overcome these issues, cameras and lenses with tighter tolerances must be used. For sensors, some lenses have tip/tilt control mechanisms to overcome this factor. Note that some line scan sensors can have swale, meaning they are not fully flat; this cannot be mitigated or removed via tip/tilt control.


 Previous Section























































or view regional numbers
QUOTE TOOL
enter stock numbers to begin
Copyright 2023 | Edmund Optics, Ltd Unit 1, Opus Avenue, Nether Poppleton, York, YO26 6BL, UK
California Consumer Privacy Acts (CCPA): Do Not Sell or Share My Personal Information
California Transparency in Supply Chains Act